Inspection process and description:
Inspection process and description:
The process of detailed roughness inspection of chips using White Light Interferometry (WLI) technology typically includes the following steps:
1. Sample Preparation:
- Firstly, prepare the chip samples to be tested, ensuring that their surfaces are clean and smooth to ensure accurate inspection results.
2. White Light Interferometer Setup:
- Place the chip on the detection platform of the white light interferometer and adjust the instrument's parameters and position to obtain high-quality interference images.

Figure 3: WLI (White Light Interferometry) System Architecture
3. Surface Scanning:
- Activate the white light interferometer to scan the surface of the chip and obtain interference images of its surface. The white light interferometer measures height variations on the surface using the interference phenomenon to gather surface topography information.
4. Data Collection and Analysis:
- Convert the collected interference images into digital data and perform analysis. Specialized software is typically used to process the data and extract surface roughness parameters such as Root Mean Square (RMS) roughness and surface peak-to-valley height.
5. Presentation of Results:
- Display the analyzed roughness parameters, usually in graphical or numerical form. Reports or records can be generated as needed for further analysis and reference.
6.Quality Control and Adjustment:
- Conduct quality control based on the inspection results. If chip surface roughness exceeds specified limits, adjustments or corrections to the manufacturing process may be necessary.
Through the above process, utilizing white light interferometry technology enables detailed and accurate inspection of the surface roughness of chips, providing crucial support for quality control in the semiconductor manufacturing process.


Figure 4: White Light Interferometry Fringes
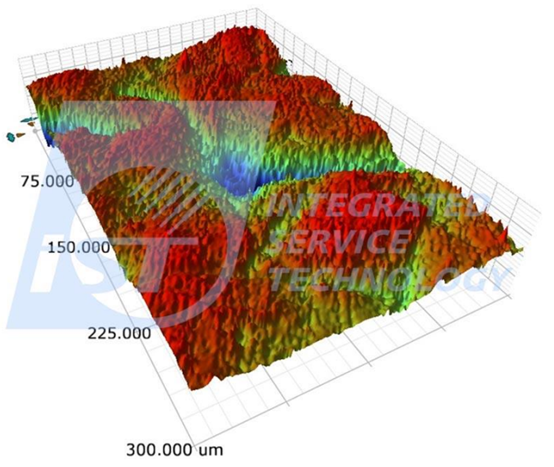
Figure 5: 3D Surface Topography
Figure 6: 2D / 1D Surface Topography and Analysis of Roughness (Ra Value)
Common parameters of roughness:
Ra: Average roughness
Rq: RMS roughness
Rv: Max valley depth
Rp: Max peak height

Rt: Max height of the profile